
Graph view
The graph draws your vault as a living map: every note a node, every link an edge, arranged by a physics simulation. It comes in two sizes, the whole vault and the neighborhood of one note.
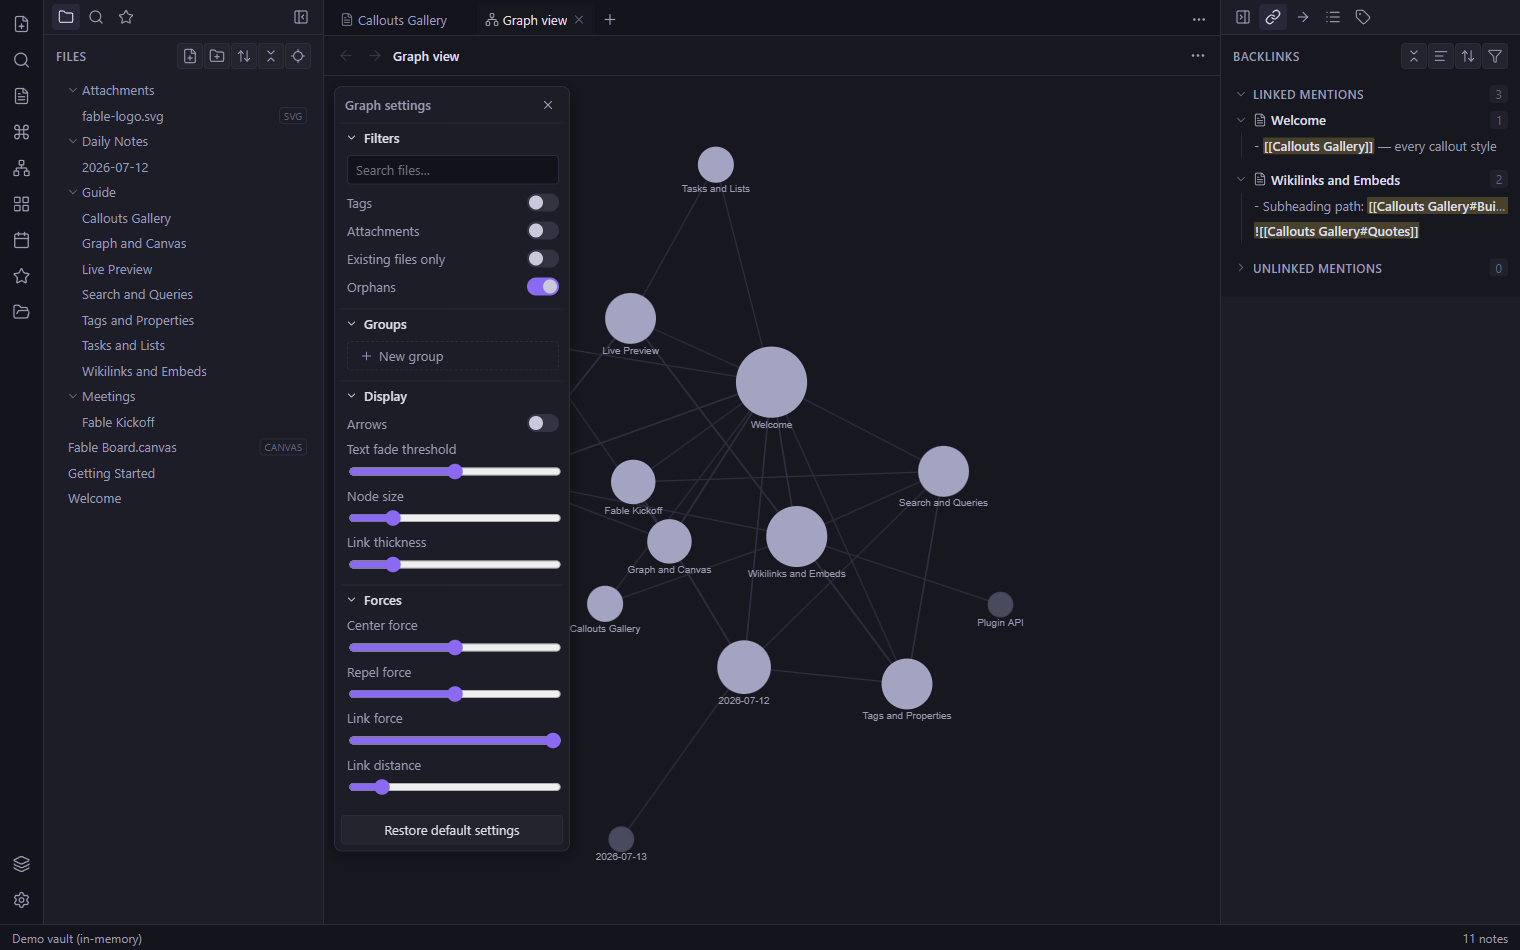
What the graph shows
| Element | Meaning |
|---|---|
| Node | A note. Optionally also tags, attachments, and unresolved links, shown as ghost nodes for notes that do not exist yet. |
| Edge | A link between two notes, from wikilinks, Markdown links or embeds. |
| Node size | Grows with the number of references a note has, so hubs stand out. |
| Orphan | A note with no links in or out. You can show or hide them. |
Opening the graph
- Global graph: click the graph icon in the ribbon, or run Graph view: Open graph view from the command palette.
- Local graph: run Graph view: Open local graph to see just the notes around the active note. It re-centers as you move between notes, and works well docked in the right sidebar.
Navigating
| Input | Action |
|---|---|
| Scroll, or + / - | Zoom in and out |
| Drag empty space, or arrow keys | Pan (Shift + arrows pans faster) |
| Hover a node | Highlight it and its direct neighbors; everything else dims |
| Click a node | Open the note; the usual modifier clicks open it in a new tab or split |
| Drag a node | Reposition it; the simulation reflows around it |
Node labels fade in as you zoom closer, controlled by the text fade threshold below.
The settings panel
The panel in the corner of the graph has four collapsible groups. Its state is remembered.
Filters
- Search files narrows the graph with a full search query, so
path:"Projects" -tag:#archivemaps just that slice of the vault. - Tags, Attachments and Orphans toggle those node kinds.
- Existing files only hides unresolved ghost nodes.
Groups
Color groups paint nodes that match a query. Add a group, give it a query like tag:#idea or path:"Work", and pick a color. Groups make different areas of a big vault instantly readable.
Display
- Arrows draws link direction.
- Text fade threshold sets when labels appear as you zoom.
- Node size and link thickness scale the drawing.
- Animate replays your vault in creation order, a small time-lapse of your thinking.
Forces
Four sliders tune the physics: center force pulls the whole graph together, repel force pushes nodes apart, and link force and link distance set how tightly connected notes cluster. There is a reset control if you push the physics somewhere unhelpful.
Local graph controls
The local graph adds two things:
- A depth slider: 1 shows direct neighbors, 2 adds their neighbors, and so on outward.
- Incoming and outgoing link toggles, to show only what points at the note, only what it points to, or both.
Working with large vaults
The simulation's cost grows with nodes and edges, so a many-thousand-note graph settles more slowly. To keep it snappy:
- Filter with a search query, or hide tags, attachments and orphans.
- Turn on Existing files only to drop ghost nodes.
- Prefer the local graph with a small depth for day-to-day browsing.
- Raise repel force or link distance to spread a dense tangle apart.